Two Hidden Inflations
Why "Real Income" is Up But Life Feels Harder
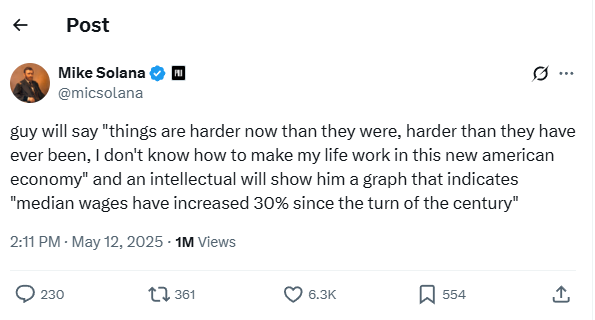
I would never do that! Real median household income is only up about 16% since the turn of the century. See, here’s my graph:
I could point out that since 1967 the real income of the top 10% has gone from about twice the median to three times the median, or that since 2000, the bottom 10th percentile only went from $18k to $19k, averaging about a 0.3% increase per year.
This is irrelevant. We know inequality is up and growth was slow, but the chart still shows that real income has increased across the board.
In the last 50 years, the median household has ostensibly seen their inflation-adjusted income increase by 50%. How can people feel that things are “harder than they’ve ever been” yet also the data says it’s 50% better?
The disconnect isn’t imagined. It’s a measurement problem. All of these figures are adjusted using the Consumer Price Index (CPI)1 which has inherent limitations that stem from trying to boil the concept of inflation into a single number.
CPI fails to capture two subtle forms of inflation that disproportionally affect those with less.
The Cost of Necessities Inflation: CPI systematically understates cost-of-living increases for necessities.
The “Modern Life” inflation: The baseline standard for an acceptable life has inflated, compelling everyone to buy more expensive, complex goods and services whether they intend to or not.
Your Personal Inflation Rate is Not My Personal Inflation Rate
Inflation, at its core, is the rate at which money loses its purchasing power.
In the 1994 movie Pulp Fiction, Vincent made a big deal about Jack Rabbit Slim’s selling milkshakes for $5.2 Now, that’s cheap. Inflation 🎉
To measure this, economists need a standardized tool. In the United States, the principal tool is the Consumer Price Index (CPI)3, which tracks the average price change of a 'basket' of goods and services meant to represent typical consumer spending.
I know I started out this essay explaining its shortcomings, but I can’t understate how much of a monumental achievement of statistical engineering the CPI is. Every month, the Bureau of Labor Statistics (BLS) collects about 94,000 prices on a painstakingly selected basket of goods and services, from gasoline and groceries to pop tarts and video rentals. The goal is to create a single number that represents the average change in prices paid by the average consumer.
The key word there is average.
The CPI basket is weighted by what all urban consumers, as a group, spend their money on. This includes a little bit of everything. But the "everything" of a household in the top 10% of income looks profoundly different from the "everything" of a household in the bottom 10%. For the affluent, a larger share of spending is discretionary. For the poor, it's dominated by necessities.
The trouble begins when the prices for different goods change at dramatically different rates. And as it happens, they have.
Here’s a nice visualization showing the price changes for various categories over the last couple of decades:
The pattern is not subtle.
On the bottom, you have things that have gotten dramatically cheaper. Look at TVs, software, cell phone service, and toys. These are the triumphs of globalization and the steady march of technological progress.
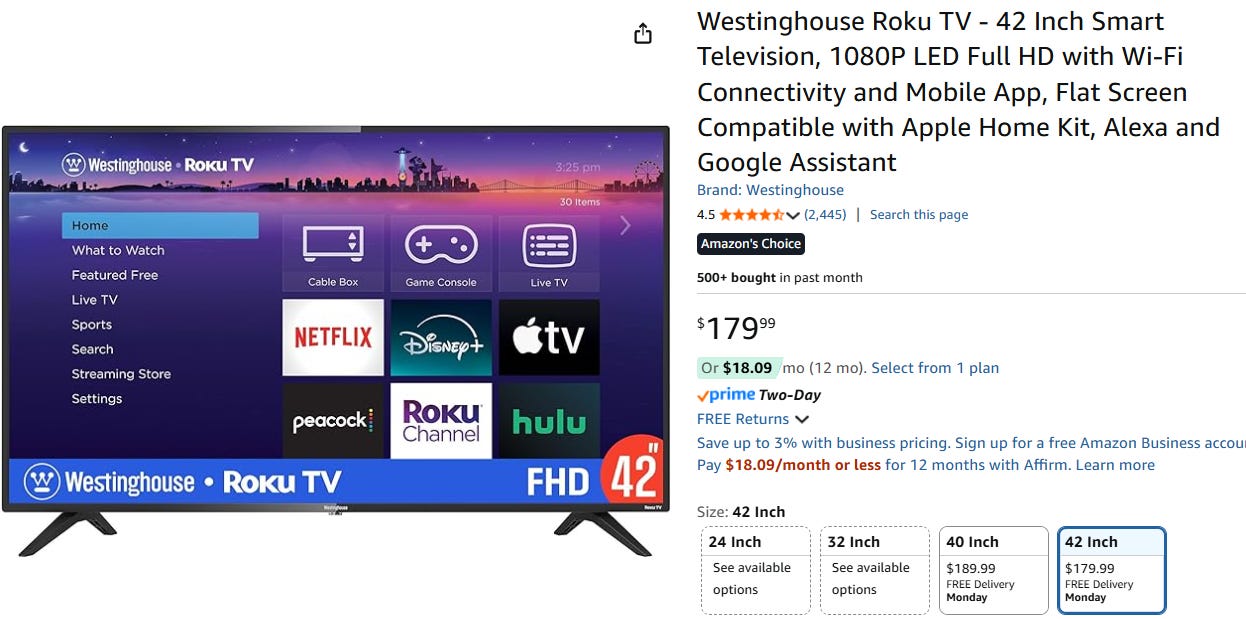
If that sexy downward sloping curve doesn’t quite have enough oomph, look at these two ads, twenty-four years apart.
That Roku TV is 2.4% the price of the Philips TV and is has Wi-Fi (though they don’t promise free set-up). The Philips TV is a “true flat screen”, only 5.8 inches deep.
On the other hand, you have the things that have become absurdly more expensive: hospital services, college tuition, medical care, and housing.
In 2001 the university of Chicago’s tuition was about $26,000. It has since risen to $71,000. A lot has happened since 2001, maybe they just have more to teach.
Which list looks more like "optional consumer goods" and which one looks more like "the basic pillars of the American Dream"?
The CPI averages these out. The plummeting price of a 42-inch television can cancel out some of the hit from a rent hike. But if you can’t make rent your options are limited. You can forego buying a new television. You cannot forego an ER visit.
This is the core of the measurement problem. The CPI inherently understates the inflation felt by households who spend a disproportionate amount of their income on the very categories that have inflated the most.
Economist Xavier Jaravel has written extensively on this phenomenon and developed a Distributional Consumer Price Indices (D-CPI). The data reflects what we would expect4.
Xavier Jaravel’s data shows that between 2002 and 2025, the cumulative inflation experienced by the 5ᵗʰ percentile was 30% higher than that of the 90ᵗʰ percentile.
Remember when I mentioned how the bottom 10ᵗʰ percentile saw annual real wage growth of 0.3% since 2000? That was using the standard CPI. The divide between 10ᵗʰ and 50ᵗʰ percentile distributional price index all but wipes that out.
There is a psychological burden when luxuries are cheap and necessities aren’t. Thriftiness is a virtue when it means making your own lunch or cancelling cable, not when you cut your pills or try to stretch your insulin to the end of the month. I think that is the weight people feel when they say they don’t know “how to make their lives work in this new American Economy.”
The Progress Paradox
When “Better” Becomes Mandatory
So, we’ve established that the CPI is flawed for measuring costs of necessities. That explains a significant part of the disconnect.
But there’s a second layer to the problem. What if it’s not just that we’re using the wrong basket of goods to measure inflation, but that the nature of the goods in the basket has changed? This is the other inflation, a kind of mandatory lifestyle inflation where the baseline for participation in society becomes more expensive.
If you’re a BLS statistician, how do you compare that 2025 flat screen Roku TV with Wi-fi, home assistant compatibility, 1080p full HD resolution compared to the 2001 Philips TV with none of that? They try to account for this with 'hedonic quality adjustments,' treating an improvement in quality as a decrease in price.
They are trying to isolate the "pure" inflation. This is a reasonable, good-faith attempt to solve a difficult problem. The issue isn’t that the logic is flawed, it’s that as the standard quality floor of a product improves, you don’t have an option to substitute down.
Consider the base model of the Toyota Camry that came out in 1982. It was about $8,000, had 90 horse power, and weighed 2,235 pounds. The base in 2025 now has 225 horsepower, weighs 3,450 pounds and costs $28,700.
The 2025 Camry is, by every measure, a better vehicle. It’s safer, more fuel efficient (despite being bigger), and has better tech. After adjusting for inflation, it’s only 6% more expensive.
The Camry isn’t alone, since 1985 the average vehicle weight in America has gone up 33% and doubled their horse power.
The weight of cars is partly a safety arms race. When showing off the Cybertruck, Elon Musk said “If you're ever in an argument with another car, you will win.” Presumably, the other car does not.
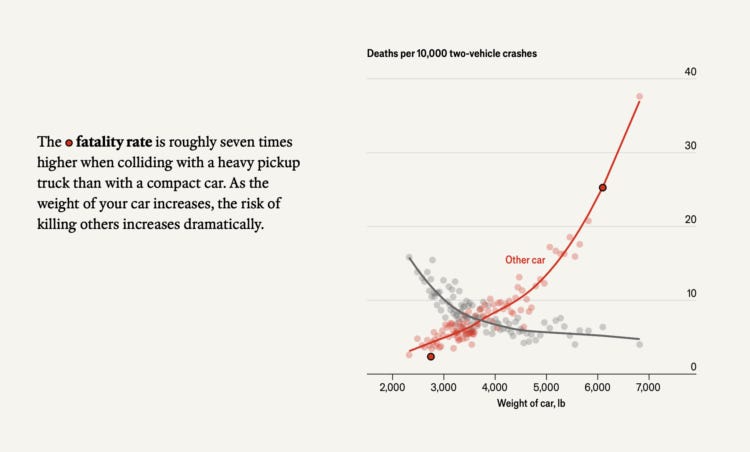
The Economist found exactly this when looking at two-vehicle collision data.
Heavier cars tend to mean fewer deaths for those driving them, the opposite is true for the other car involved.
The critical point is that you can no longer buy the equivalent of a new 1982 Camry. The market and regulations have decided that a certain baseline of safety features, emissions controls, and technology is now mandatory.5
In of itself, that isn’t a bad thing. However, instead of seeing a steep drop off in price like with TVs, we get “more car”.
This still has a deflationary affect on the CPI calculation. To use an over-simplified example, the cost per horse power for the base Camry rose 44% in 43 years, an average of 0.8% per year. This is much lower than the overall average CPI rate of 3.3% over the same period.
For many people, the only real criteria for their car is that it gets them to work reliably. Cars have gotten “cheaper” by being of higher quality for the same price, but the value from getting from point A to point B remains the same
Bigger Homes, Bigger Rents
This ‘mandatory upgrade’ dynamic is even more pronounced in housing. The inflation-adjusted price per square foot for new houses sold in the U.S. has remained fairly stable.
However, the average square feet per person for new single-family homes in the US doubled between 1973 and 2015. We are building larger homes for smaller families.
The result is that while the cost per unit of space has been stable, the minimum number of units you're forced to buy has gone up. You can't buy the small, no-frills, 1,200-square-foot new build in many areas because it simply doesn't exist.
This square-footage growth is partly market driven, partly zoning requirements. Mesquite, Texas is considering increasing its minimum home size from 1,500 to 2,000 square feet. If that ends up pricing out certain undesired populations from moving there, I’m sure that’s entirely unintended.
Of course, when calculating CPI the BLS makes adjustments for changes in quality of housing over time, which includes factors like square footage and improvements like air conditioning.
In 1970 only 35% of homes had air conditioning, now it’s up to 88%. I assume that in 1970s people in the south just died every summer.
So just like with their vehicles people now are getting twice as much house, however technology and innovation hasn’t masked the cost increase. If you’re trying to get a no-frills roof over your head, it will be bigger, it will have AC, and it will cost more.
Better Healthcare at a Cost
Finally, let’s talk about the most ‘mandatory upgrade’ of all, healthcare.
I’d like to start by saying unequivocally that the quality of medicine and medical technology has improved dramatically in the last 50 years.
In the 1970s, the 5-year survival rate for breast cancer was 25%. Radical mastectomy was the gold standard, which involved the removal of the entire breast, the underlying chest muscles and the surrounding lymph nodes.
Now the 5-year survival rate is over 90%. Mastectomies are still often performed, but there are also less invasive lumpectomies, partial mastectomies, hormone therapies, targeted gene therapies and shorter courses of more precise radiation therapy.
One can quibble with details like earlier detection marginally inflating survival rates but the overall picture remains the same.
Modern miracles haven’t come cheap. On a per capita basis, health spending has increased in the last five decades from $353 per year in 1970 to $14,570 per year in 2023. In constant 2023 dollars, the increase was from $2,151 in 1970 to $14,570 in 2023.
So how does a modern economy handle a product whose real price has increased nearly sevenfold in two generations? It attempts to introduce market principles. There have been attempts to give people choices, primarily through health insurance.
This presents the consumer with two core questions: how much risk you want to bear, and how much inconvenience you're willing to tolerate.
The Risk Paradox
When you buy health insurance on the exchange, the most visible choice is the "metal level", i.e. Bronze, Silver, Gold, and Platinum. This is essentially a bet on your own future health. A lower-tier plan like Bronze comes with a cheaper monthly premium but a much higher deductible and out-of-pocket maximum (capped at $9,200 for an individual in 2025). A Platinum plan has a much higher premium, but care is nearly free.6
The result is counter intuitive. Who benefits most from a low-deductible Platinum plan? Logically, it’s the person for whom a sudden $9,000 expense would catastrophic. The less money and savings you have, the more you need the financial protection of an actuarially “rich” plan. You simply cannot afford the risk of self-insuring.
Conversely, who is best positioned to “save money” with a cheap Bronze plan? The person who can comfortably write a check for $9,000 if something goes wrong. For them, paying a lower premium is a rational financial gamble; they have the means to self-insure against risk.
Theoretically, the people with the least financial resilience are incentivized to buy the most expensive monthly plans to protect themselves from ruin. The wealthy can opt for “cheaper” insurance because they don't actually need it as a backstop.
The person who most needs to avoid a $9,000 bill is precisely the person least able to afford the monthly premium to do so.
The Inconvenience Tax: HMO vs. PPO
The other major choice is the type of network, most commonly an HMO (Health Maintenance Organization) versus a PPO (Preferred Provider Organization). In broad strokes, an HMO is cheaper but restricts you to a specific network of doctors and requires referrals to see specialists. A PPO is more expensive but gives you the freedom to see almost any doctor you want.
A PPO plan might cost 20% more than its HMO equivalent. But here’s the critical point: legally and medically, they must both provide the same standard of care. An HMO cannot give you a worse cancer treatment. Your chemotherapy regimen will be determined by oncologists, not accountants.7
So what does the extra 20% for a PPO actually buy you? It buys convenience and access. It’s a fee to bypass gatekeepers. It's the ability to self-refer to the top-rated specialist across town without waiting three weeks for your primary care physician to approve it. You're not paying for a better medical outcome, you're paying to reduce administrative friction and wait times. It’s a luxury tax on your time.
Ultimately, these choices do little to address the underlying driver, the $14,570 per capita cost of the care itself. They are risk-management products that force individuals into complex calculations about their finances and their health.
You Will Have the Best Care, or Nothing
In most functional markets, consumers can substitute down. If the name-brand cereal costs too much, you can buy the one in the bag. This provides a release valve for price pressure.
Healthcare in America has largely removed this valve. You are not allowed to choose the 1990s standard of care, even if it were 80% as effective for 20% of the cost. The system is built around a single, ever-advancing, and ever-more-expensive standard of care.
Consider the case of Stivarga (regorafenib), a drug used to treat metastatic colorectal cancer. In the CORRECT trial, patients with metastatic colorectal cancer treated with Stivarga survived a median of 6.4 months versus 5.0 months for those on placebo. A 30-day supply of Stivarga is about $25,000 and the median duration of treatment in the trial was 1.7 months. For $42,500 the treatment purchased, on average, an extra six weeks of life.
For the healthcare system, it's a cost that's hidden from the consumer at the moment of decision. Any patient receiving such a drug has already met their annual out-of-pocket maximum. From their perspective, the marginal cost of the $42,500 treatment is zero. The system is designed to shield them from the cost, and in doing so, it removes their financial incentive to question the price tag.
But this entire framework of being locked into an expensive treatment plan once a deductible is met presumes the patient can afford the ticket to ride in the first place. For a huge swath of the population, that is not a safe assumption. According to the Federal Reserve, in 2023, 27% of American adults skipped some form of medical treatment because they couldn't afford it.
This is the other side of the “no buy-down” coin. The lack of a cheaper, “good enough” option doesn't mean everyone gets the best care. It means there is a cliff. On one side is the state-of-the-art, incredibly expensive standard. On the other side is an abyss. People aren't choosing a less effective but more affordable cancer drug; they are splitting their pills, skipping their prescriptions, and avoiding the doctor's visit that might lead to the diagnosis in the first place.
The true dilemma of the American healthcare market isn't just that we're forced to pay for marginal gains. It's that the system has created a binary choice: the best care imaginable, or no care at all.
Final Thoughts
The disconnect between economic indices and the public mood is real, and it stems from two compounding problems.
First, the official inflation metric is a poor fit for lived experience. The CPI masks the inflation of necessities by averaging it with the deflation of consumer gadgets.
Second, the Progress Paradox has made the baseline for participating in society more expensive. We are compelled to buy better cars, bigger homes, and more advanced healthcare because the simpler, more affordable versions are no longer on the market. Our inflation metrics interpret these quality upgrades as a form of deflation. But for the person who just needs a reliable car for work and roof over their head, the cost to secure that basic utility has risen.
This is the core of the conflict. A statistician sees that the “hedonic quality-adjusted” price of a car has halved. The cost to get to work has not.
The data isn't wrong, it's just measuring the wrong thing. It's tracking the price of goods, while people are struggling with the cost of life.
Technically they used the Chained Consumer Price Index For All Urban Consumers (C-CPI-U) for 2000-2023 and the Consumer Price Index retroactive series using current methods (R-CPI-U-RS) for pre-2000; their “Table A-4a” had over 20 footnotes. I’m oversimplifying things and the BLS is pretty thorough.
That’s about $11 now. It’s a touch expensive, but they’re in LA so his reaction was a bit much. There are actually fan theories that the movie really takes place in the 80s putting it closer $20 now.
Again, there isn’t just one CPI; it’s more a family of related indices that each have their own strengths, weaknesses, and purposes.
I mean this broadly speaking; post-Covid in the US middle income families had higher inflation than that of lower and upper income families due to things like vehicle and gasoline costs. This is a departure from historical norms and probably not a long term trend, but so is a world-wide pandemic (I hope).
Yes you can buy used, but the same is true of people in the 1980s so it doesn’t really change the fundamental calculus.
To be more precise, the insurance plan expects to pay for about 60% of care for those with Bronze plans, and 90% for those with Platinum. That 60% is called the “actuarial value” of the health plan.
I think a lot of people would object here, but that is a whole different discussion.


